Strava Dashboard: Season-Long Insights
2026 · Personal project, Data visualization, Strava MCP
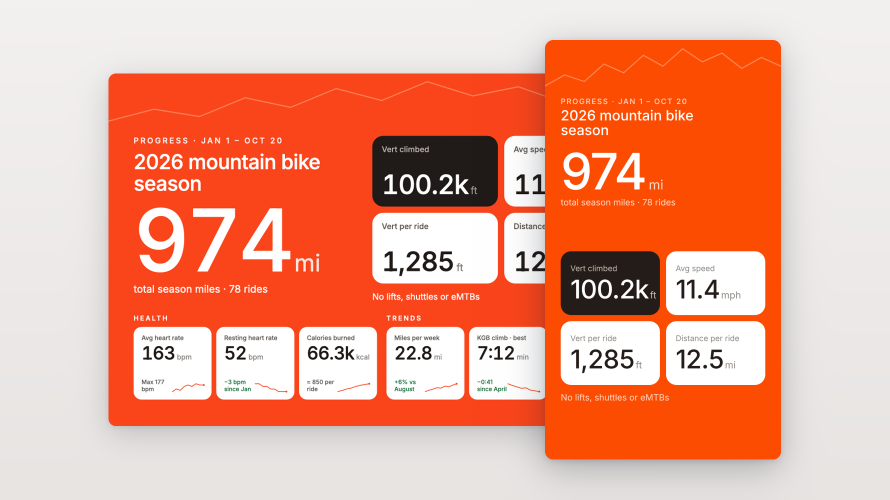
Project overview
Using the Strava MCP, I built a set of dashboards to more effectively visualize data and calculations not clearly available in Strava's UI. This is a passion project and will continue to develop this, with the goal of providing open source prompts and skills for others to replicate for their own pursuits.
Key work
- Researched and compiled desired but missing Strava attributes
- Defined the visual system, type hierarchies and styles
- Captured notes and successful prompts, for future distribution of this functionality
I'd love to share more about this project, let's get in touch!